Multiple Y Axes
Advertisement

Multiple Y Axes for Excel v.1.01
Multiple Y axes plots are created from existing Excel Charts.
Advertisement
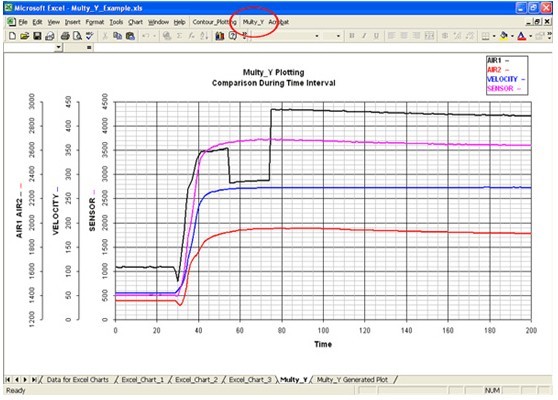
Multy_Y v.1.01
Multiple Y axes plots are created from existing Excel Charts. Each Excel chart appears as a new Y axis on the Multy_Y plot. The plot is a picture that appears on a separate Excel Chart.
EZplot v.1 1
EZplot is an Excel add-in and trademark of Office Expander. The software design is targeted to improve productivity in creating Excel plots and performing data calculations in Microsoft Excel (from the Microsoft Office Suite).
EZplot for Excel v.1.01
EZplot is a plotting and data calculation computer software which enhances Excel. EZplot improves productivity by easily creating many plots in seconds. Plots are defined with parameter names instead of requiring manual selection of data.
Contour Plot v.1 1
Real contour plots are created in Excel. You can interact with the contour plot just like any other Excel plot. Contour Plot works with any contour data. It accommodates rectangular data, nearly rectangular data, and irregular data.
Contour Plot for Excel v.1.01
Create real contour plots in Excel using any data (rectangular, nearly rectangular, or irregular data).
PsychroGen v.2.0
Advanced, free to download, psychrometric charting and calculator software with numerous unique features. Number of types of charts: Over 60 types of charts in addition to Psychrometric Charts and Mollier Diagrams User-selectable X and Y axis
EcGraph for Visual Basic 6 v.3.0.0.0
ecGraph is a powerful graphing ActiveX control that you can drop into your Visual Basic programs to create graphs in a huge range of styles. More Information : http://visualbasic-6.com/ecgraph-for-visual-basic-6.html

EcGraph
Powerful graphing ActiveX control that you can drop into your Visual Basic programs to create graphs in a huge range of styles. Great for scientific or technical graphs. You can get a graph up and running with just a few lines of code, and can manipulate

PlotLab .NET v.6.0
PlotLab .NET is a set of .NET 2.0-4.5 components for very easy and fast Data Visualization. Allows very fast display in a Plot/Scope/Chart or Waterfall form. Great for FFT or Histogram Visualization! Free for non-commercial use.

PlotLab VCL v.7.0
Delphi/C++ Builder VCL/FMX components library for very easy and fast Data Visualization. Allows very fast display in a Plot/Scope/Chart or Waterfall form. Great for FFT or Histogram Visualization! Free for non-commercial use.